Appendix C
Income and Outlays in Dutch Taiwan
Explanation of Table
The following table is based on the careful work of Nakamura Takashi 中村孝志. I encourage readers to consult Nakamura’s articles, which contain much information about his data, but I do wish to call attention to three issues. First, during the seventeenth century, the Dutch East India Company’s overseas offices did not always report results according to a fixed fiscal calendar. In some years, officials reported results by calendar year (as, for example, in the period 1634–1636), whereas in other years, they used different intervals, such as October through September. Such irregularity means that the data are not wholly uniform year to year. Nonetheless, they are good enough for large-scale conclusions, especially for the 1640s and 1650s, which tended to have more regular fiscal periodization.
Second, the type of information itself differed year to year. In general, one can distinguish between Trade Income (handelsinkomsten) and Land Income (landsinkomsten, Taiwansinkomsten, or, sometimes, generale inkomsten), but this is not always possible. Therefore, amounts in the column "Land Income" may in some cases include income that is not, strictly speaking, land income. At other times (as, for example, in 1638–1639, 1639–1640, and 1646–1647), the "Land Income" and "Trade Income" amounts do not add up to "Total Income." This is because there were sometimes residual revenues that Dutch accountants did not place into either of these categories.
Finally, in Nakamura’s original tables, amounts are given as they appeared in seventeenth-century Dutch sources, according to the following format: florin, stuiver, penning. Florin was another word for gulden, the basic unit of Dutch currency. There were 20 stuivers in a florin and 16 penning in a stuiver. I have rounded figures to the nearest florin.
Income and Outlays in Dutch Taiwan, 1631–1661, in Dutch Florins
| Year | Total Income |
Trade Income |
Land Income |
Total Expenditures |
Net Income |
|---|---|---|---|---|---|
| 1631 | (50,024) | ||||
| 1632–1633 | 89,898 | 76,960 | 12,938 | ||
| 1633–1634 | 193,392 | 96,980 | 96,411 | ||
| 1634 | |||||
| 1635 | 137,164 | 230,656 | (93,492) | ||
| 1636 | 223,808 | 132,601 | 91,207 | ||
| 1636–1637 | 119,122 | 112,844 | 6,278 | 168,627 | (49,505) |
| 1637–1638 | 203,322 | 287,646 | (84,325) | ||
| 1638–1639 | 132,623 | 107,406 | 24,494 | 302,870 | (170,247) |
| 1639–1640 | 268,933 | 187,607 | 21,324 | 255,344 | 13,589 |
| 1640–1641 | 233,096 | 216,562 | 16,534 | ||
| 1641–1642 | 162,350 | 109,464 | 52,887 | 223,666 | (61,316) |
| 1642–1643 | 346,485 | 258,007 | 88,478 | 150,481 | 196,003 |
| 1643–1644 | 318,038 | 98,500 | 234,186 | 83,852 | |
| 1644–1645 | 194,933 | 77,714 | 117,220 | 232,563 | (37,629) |
| 1645–1646 | 238,284 | 122,871 | 115,413 | 264,255 | (25,971) |
| 1646–1647 | 402,343 | 224,246 | 135,049 | 246,687 | 155,656 |
| 1647–1648 | 806,239 | 561,189 | 207,844 | 236,341 | 569,898 |
| 1649 | 1,070,000 | 708,000 | 321,000 | 603,000 | 467,000 |
| 1649–1650 | 882,612 | 494,300 | 388,312 | 360,677 | 521,935 |
| 1650–1651 | 713,705 | 435,911 | 277,794 | 344,294 | 369,410 |
| 1651–1652 | 731,562 | 429,382 | 302,181 | 390,126 | 341,436 |
| 1652–1653 | 667,701 | 381,931 | 285,770 | 328,784 | 338,917 |
| 1653–1654 | 593,625 | 375,050 | 218,575 | ||
| 1654–1655 | 567,290 | 276,008 | 291,282 | 453,368 | 113,922 |
| 1655–1656 | 536,255 | 372,742 | 163,513 | ||
| 1656–1657 | (74,692) | ||||
| 1657–1658 | 930,154 | 528,867 | 401,287 | ||
| 1658–1659 | 598,800 | 393,091 | 205,708 | ||
| 1659–1660 | 425,352 | 418,010 | 7,342 | ||
| 1660–1661 | 257,049 | 386,597 | (129,548) | ||
Graphs
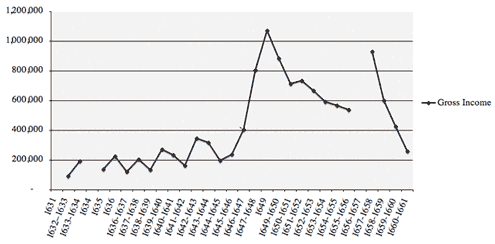
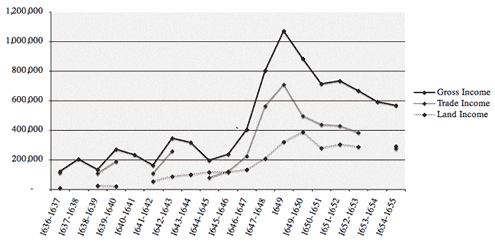
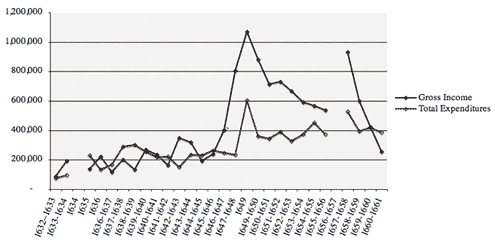
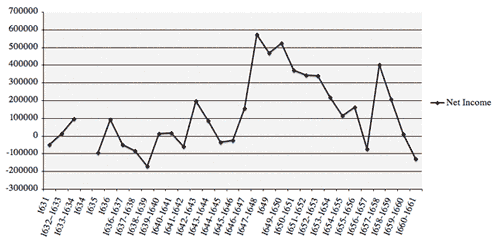
The following graphs were generated using the data presented in the table above.
Total Gross Income in Dutch Taiwan, 1631–1661, in Florins
Land Income Versus Trade Income in Dutch Taiwan, 1637–1655, in Florins
Income Versus Expenditures in Dutch Taiwan, 1633–1661, in Florins
Net Income in Dutch Taiwan, 1631–1661, in Florins
^top


