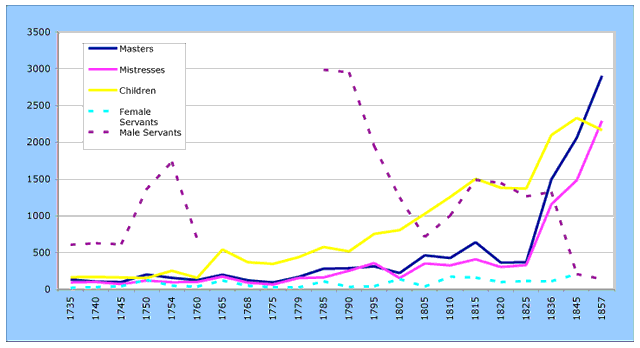
Figure 3.9
Summer Inhabitants, Southern Avalon, 1735-1857 (Five-Year Intervals) - Planter Group and Servants

Notes: As in Figure 3.8, data representing five-year intervals have been used, when available, up to and including 1825. When complete data are not available for an interval year, data for the next closest year, when available, have been used. After 1825, the intervals in the chart range from nine to twelve years in accordance with the census years. Again, these figures exclude personnel in the ship, bye-boat, and bank fisheries.
1735�Petty Harbour was included in the return for Bay Bulls.
1740�No return existed for St. Mary's, but numbers would have been fairly low at this point.
1790�1826�Only a total of summer inhabitants was reported, with no specific breakdown. However, in the data for 1735�85, there was a degree of consistency in the percentage increase in all categories from the previous winter, with the exception of male servants, whose numbers fluctuated widely. Based on this earlier data, I calculated an average rate of increase in numbers from winter to summer as follows:
| Masters | 1.06% |
| Mistresses | 1.03% |
| Children | 1.09% |
| Women servants | 1.02% |
Once the increased numbers were calculated for these categories, the balance of the total summer population not accounted for was attributed to male servants.
1810�Data for Bay Bulls were not reported, and so an average for Bay Bulls has been estimated from 1809 and 1811 returns for that community.
1836�As noted in the previous figure, numbers of servants were overreported for individual communities of Ferryland district. There was obviously an overlap in reporting so that some residents were reported as both masters/mistresses and servants, because their combined numbers exceed total population figures and combined totals of religious denominations for the district. (The total population figures and the combined totals of religious denominations do correspond.) In the abstract at the end of the census, there is a separate total of servants, which does tally with the other totals, and that is the number that has been used here. No separate summer/winter breakdown appeared in census data for 1836, 1845, and 1857.
1845�A total of 211 servants were reported for Ferryland district but were not differentiated by sex or community.
1857�A total of 141 servants were reported for Ferryland district but were not differentiated by sex or community. Also, age categories shifted in this census, the most significant for current purposes being the change from a category "under 14" to a category "under 10."
Sources: CO 194 Series, Governors' Annual Returns of the Fisheries and Inhabitants at Newfoundland, 1735�1825; and Newfoundland Population Returns, 1836, 1845, and 1857.
^top